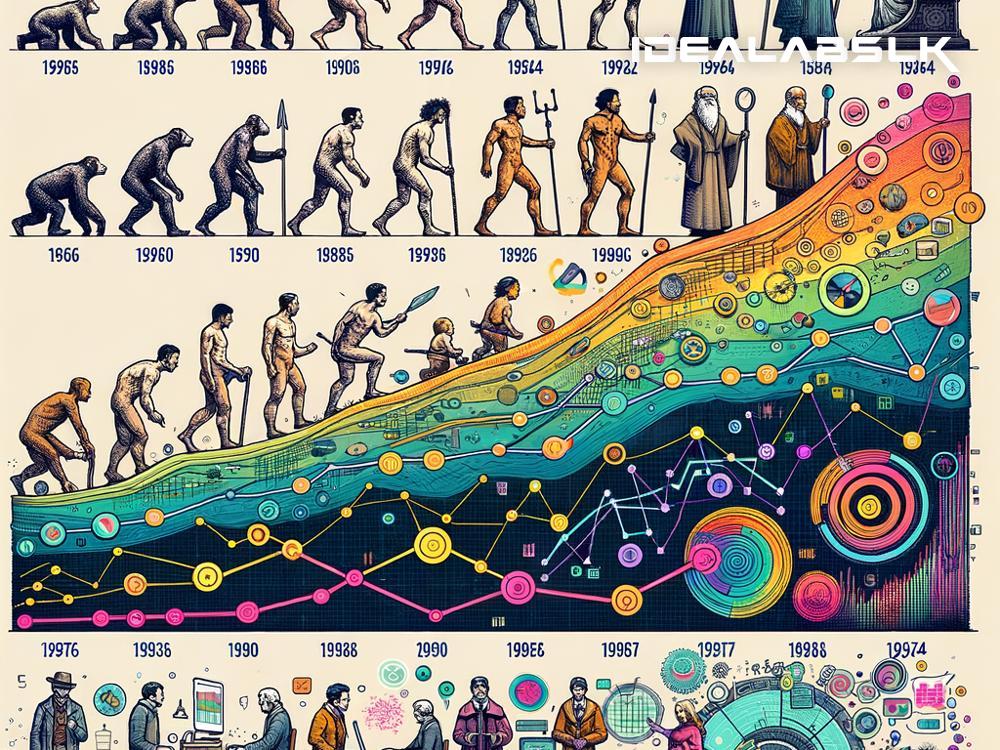
Title: The Incredible Journey of Data Visualization
In an era bombarded with information, data visualization has emerged as a beacon of clarity, transforming complex datasets into understandable and engaging visuals. It's like translating a foreign language into our native tongue, making the incomprehensible suddenly clear. The evolution of data visualization techniques is not just a technical advancement but a story of how we, as humans, have strived to make sense of the world around us.
The Origins: Drawing on Cave Walls
Believe it or not, data visualization dates back thousands of years. Imagine ancient humans drawing on cave walls, not just as an act of art, but as an early form of data communication – depicting successful hunting expeditions or lunar phases, for instance. These rudimentary visuals were essentially the first attempts at conveying information beyond spoken words, laying the foundational stone for what would evolve into modern data visualization.
The Middle Ages: Mapping the World and Beyond
Fast forward to the Middle Ages, and we see the rise of maps as a form of data visualization. Maps were revolutionary in illustrating territories, navigation routes, and resources. The work of early cartographers was pivotal, enabling explorers to venture into the unknown. Astrolabes and armillary spheres allowed scholars and navigators to visualize celestial information, intertwining astronomy and data visualization.
The 17th to 19th Centuries: The Birth of Statistical Graphics
The 17th to 19th centuries marked a turning point with the introduction of statistical graphics. Pioneers like William Playfair, who invented the bar chart, line graph, and pie chart, revolutionized how data was displayed. These innovations provided a clearer understanding of economic and social patterns, facilitating informed decision-making. It was a period that underscored the shift from mere observation to a more analytical approach towards data.
The 20th Century: The Digital Dawn
The advent of the digital era in the 20th century catapulted data visualization into a new realm. Computers enabled the processing of vast amounts of data at unprecedented speeds. Software tools began to emerge, allowing for the creation of complex and dynamic visualizations. John Tukey's development of exploratory data analysis emphasized the importance of visualizing data to understand underlying patterns and anomalies. This period also saw the rise of infographics, blending design and data to inform and engage a broader audience.
The 21st Century: Visualization for the Masses
As we stepped into the 21st century, data visualization became more than a tool for scientists and statisticians; it became a universal language of understanding in an information-rich world. Today, anyone with access to a computer and the internet can create visualizations. Tools like Tableau, Microsoft Power BI, and open-source libraries such as D3.js have democratized data visualization, putting powerful analytics and presentation capabilities into the hands of the many, not just the few.
The Future: Immersive and Interactive Visualizations
Looking ahead, the future of data visualization is poised for even more fascinating developments. Virtual Reality (VR) and Augmented Reality (AR) are beginning to find applications in data visualization, offering immersive experiences that provide deeper insights. Imagine walking through a data-generated forest where each tree represents a data point, or viewing complex datasets projected onto the physical world through AR glasses. Artificial Intelligence (AI) and Machine Learning (ML) are also playing a role, with algorithms that can automatically generate visualizations or uncover patterns that would be impossible for humans to identify on their own.
Simplifying Complexity
At its core, the evolution of data visualization techniques is about simplifying complexity. As the volume of data grows, so does our need to understand and communicate it effectively. The journey from cave paintings to immersive VR experiences reflects our relentless pursuit of clarity and comprehension. Data visualization acts as a bridge between data and decision-making, insight, and action.
In Conclusion
As we continue to navigate through the data deluge of the 21st century, the importance of data visualization cannot be overstated. It empowers us to see the stories hidden within numbers, to make informed decisions, and to share our insights with the world. The evolution of data visualization techniques is a testament to our inherent desire to understand and communicate – a journey that is as much about our relationship with data as it is about the tools and technologies we develop to visualize it.

